Transforming the User Experience with SAP BPC 11.0
Transforming the User Experience with SAP BPC 11.0
Introduction:
SAP Business Planning and Consolidation (SAP BPC) 11.0 for BW/4HANA reimagines the business end user experience, providing business users streamlined access to their critical information and process. The user interface has been updated according to SAP Fiori design principles, providing role and activity-based functionality, while continuing SAP BPC’s legacy as a powerful and flexible enterprise planning solution. The revamped landing page dashboard, updated menus, and process optimized navigation are a few examples of the significant improvements that allow users to spend more time on Analytics and less time on reporting. This front-end redesign, paired with more seamless integration capabilities with SAP Analytics Cloud and excel reporting tools, puts the user’s critical data and processes front and center.
This blog examines the most impactful user experience changes that SAP BPC 11.0 brings, in subsequent posts, we will examine the integration, modeling and functional improvements in SAP BPC 11.0.
“A Day in the Life”
Our first look at SAP BPC 11.0 will be through the eyes of Truman Quade. Truman is the North American Sales Manager for Ty’s Edibles Inc., a company which packages and sells meat products to various grocers and restaurants. The company’s sales forecasts are focused around three key products: beef, pork, and chicken. Every month, Truman’s team is responsible for generating the North American Sales forecasts.
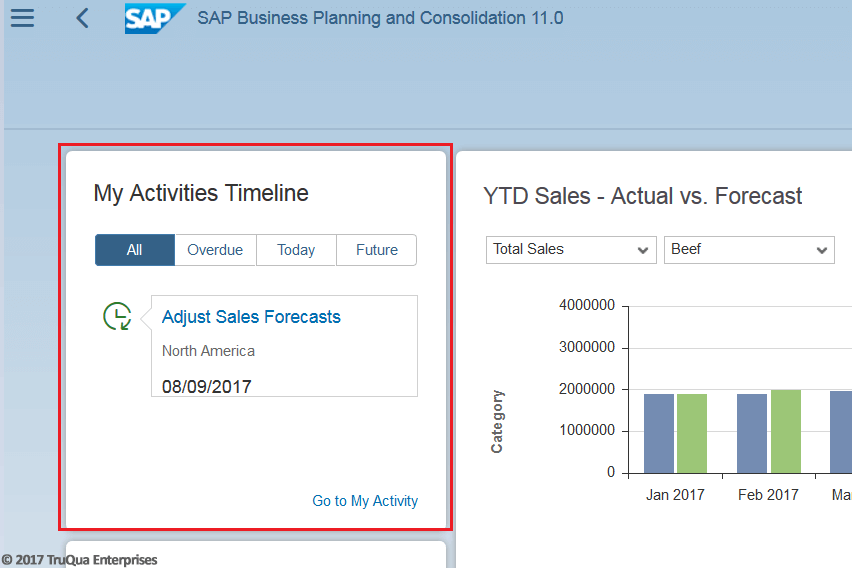
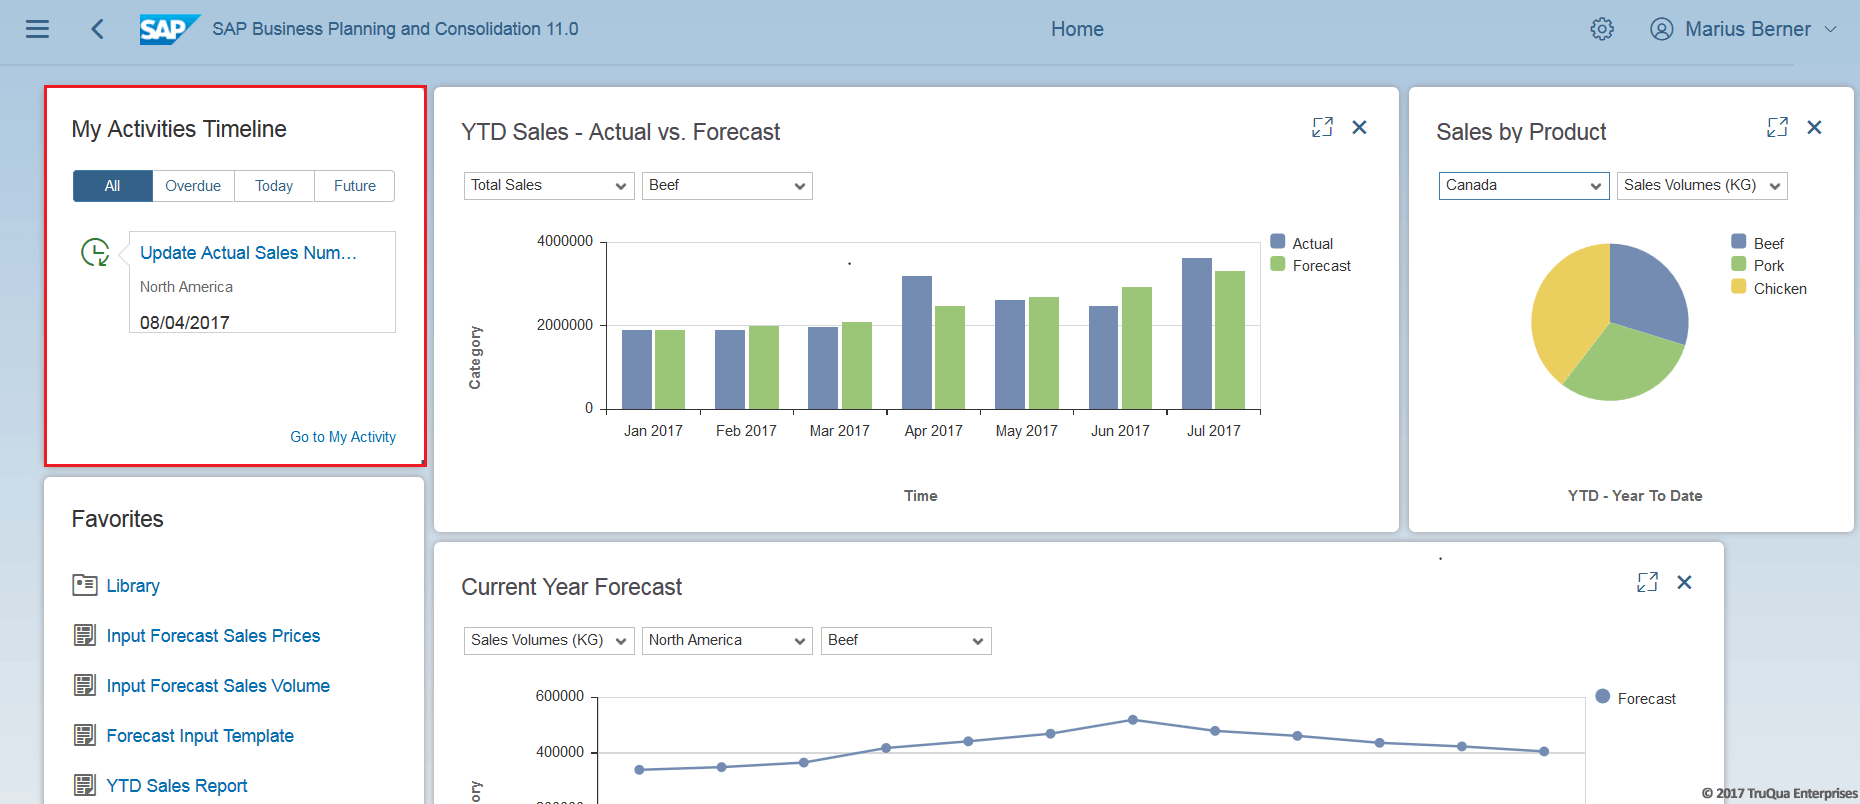
After logging into SAP BPC 11.0, Truman is presented with the SAP BPC 11.0 home page. On the home page, Truman can see a list of any pending activities that he needs to complete.
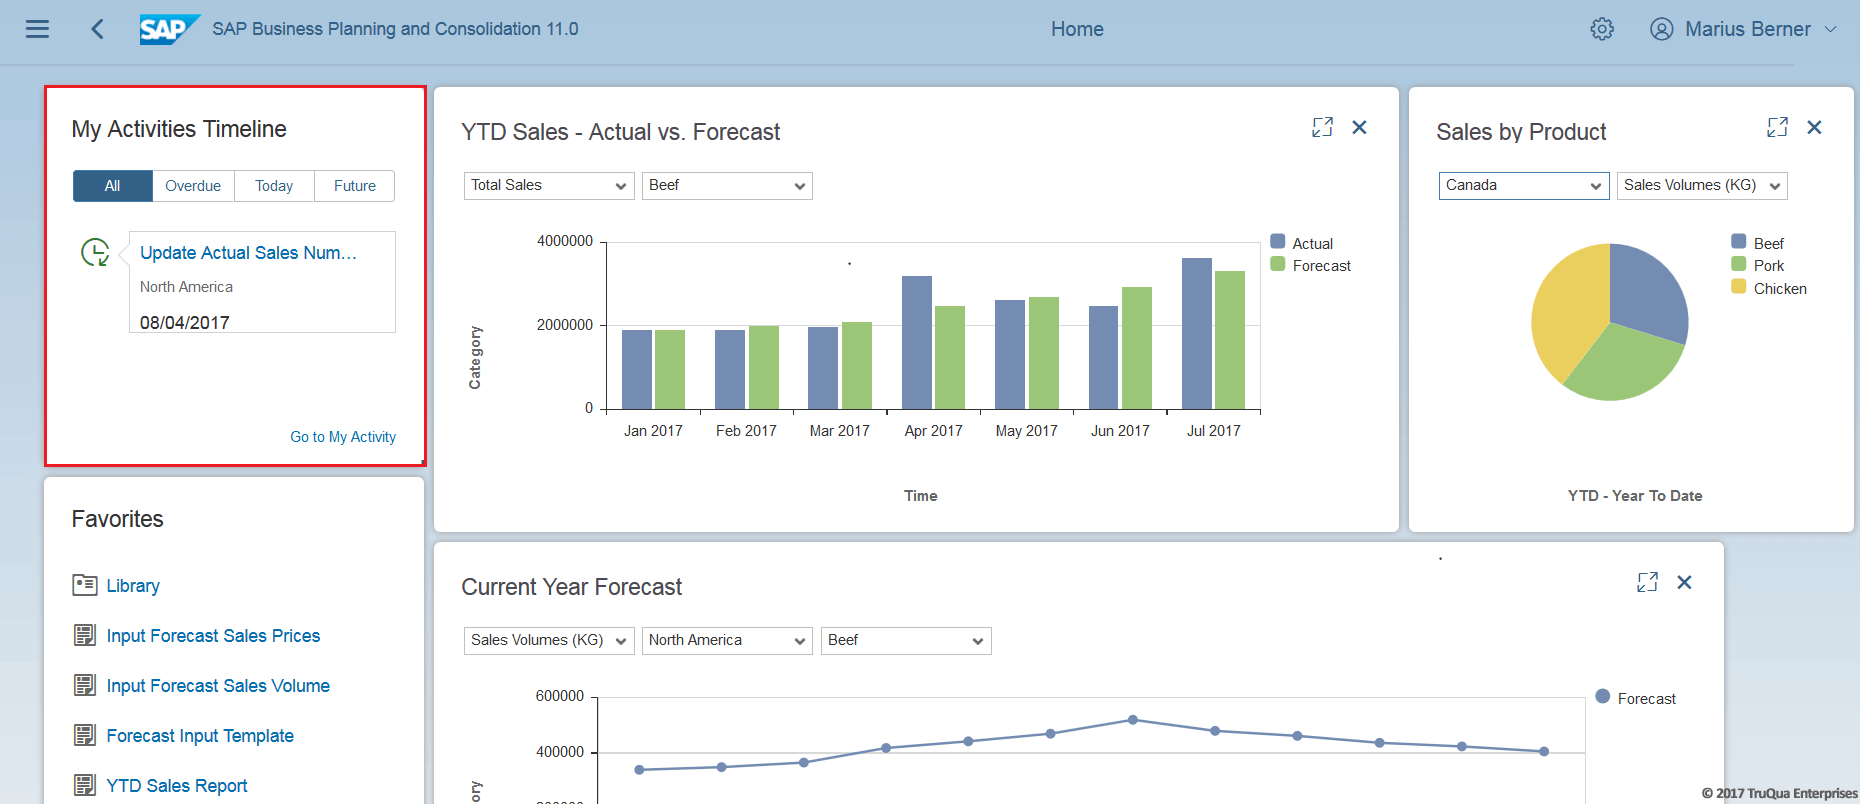
If the first task of the monthly process is to refresh sales actuals for the most recently closed period, Truman will get a reminder in his Activities Timeline to run a package, which then triggers the data update in BPC. The Activities Timeline directly links to the process and reports necessary, and provides an easier way to interact with business process flows.
SAP BPC 11.0’s landing page acts as a dashboard for Truman, who can pin critical charts and KPIs directly to the front page. This provides immediate access to the relevant data that Truman needs to manage his team. In this case, he has created and pinned a bar chart which allows him to better monitor and track his sales numbers.
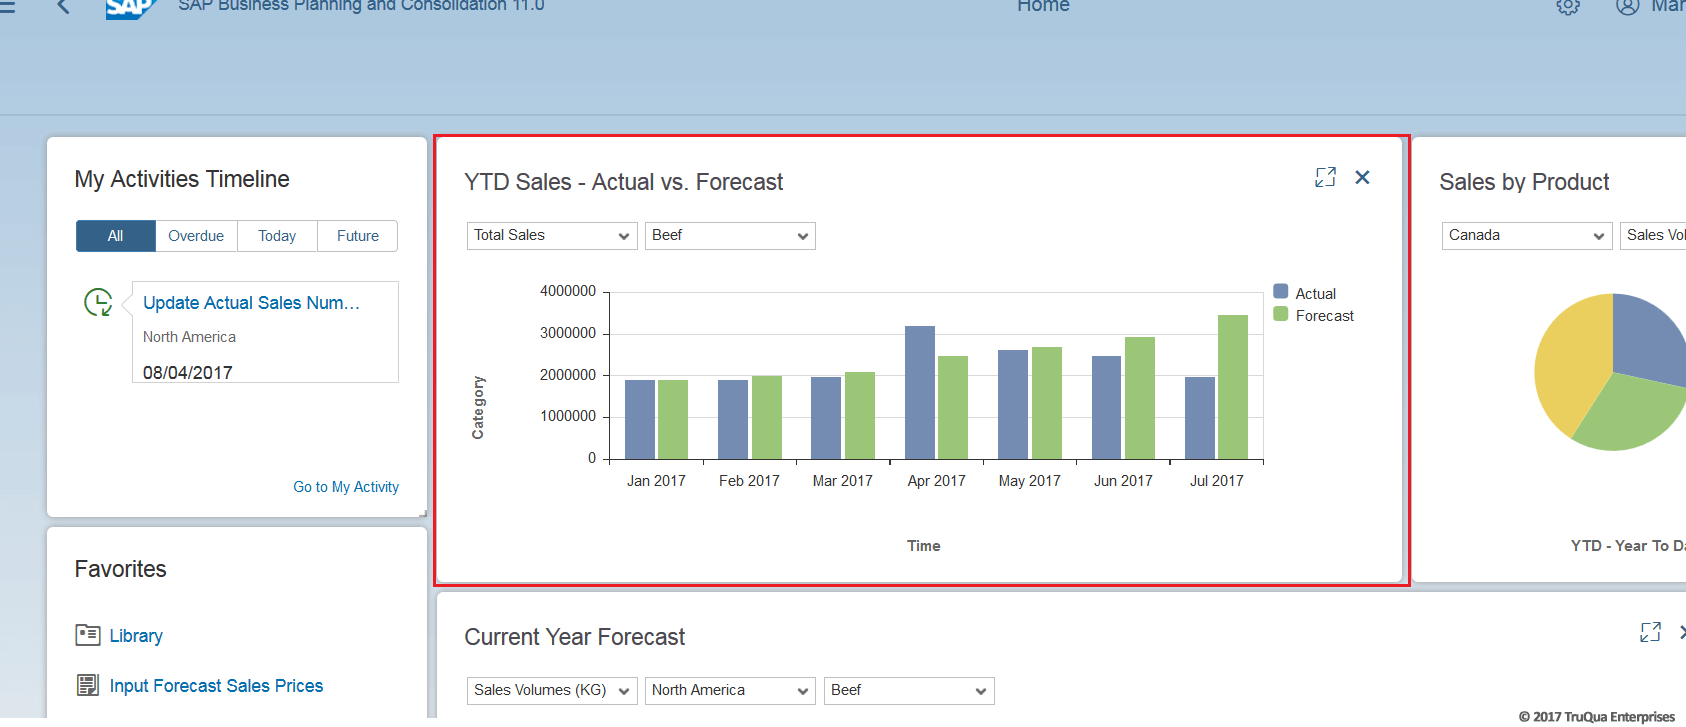
Seeing an unexpected decline in the July Sales, Truman navigates to the “Favorites” section of the home page to access the sales report and drill down on the BPC data to identify where the discrepancy is.
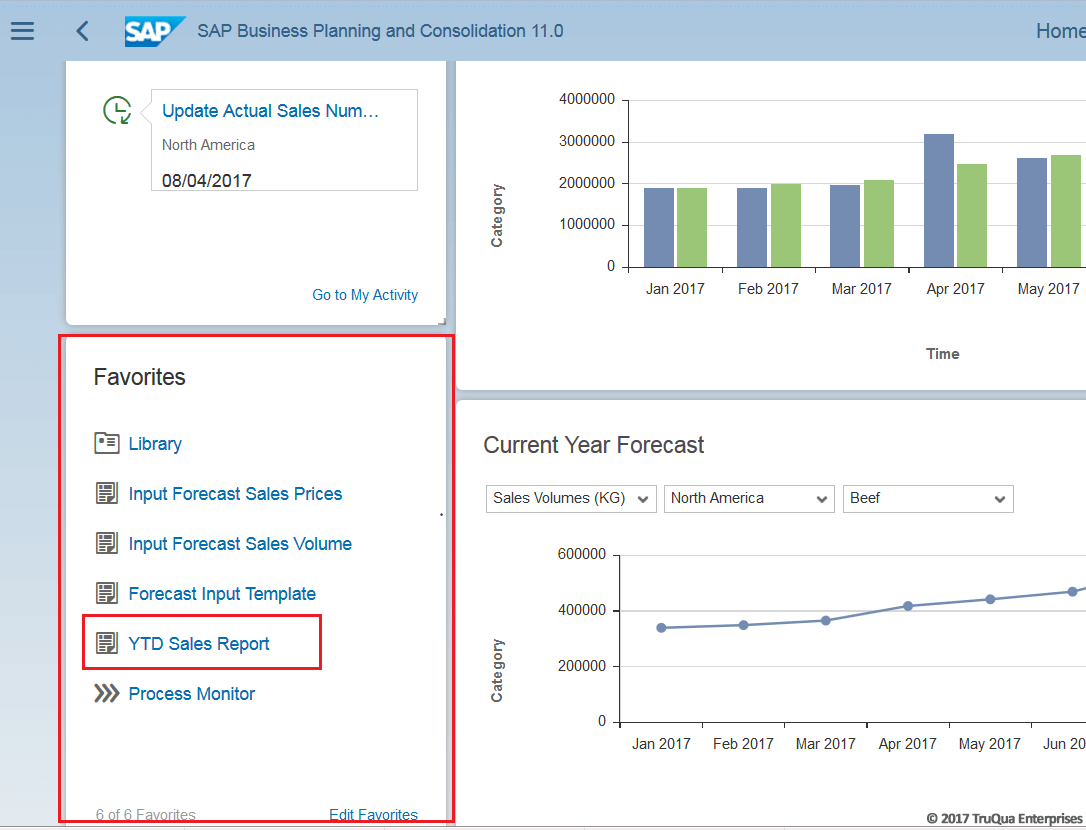
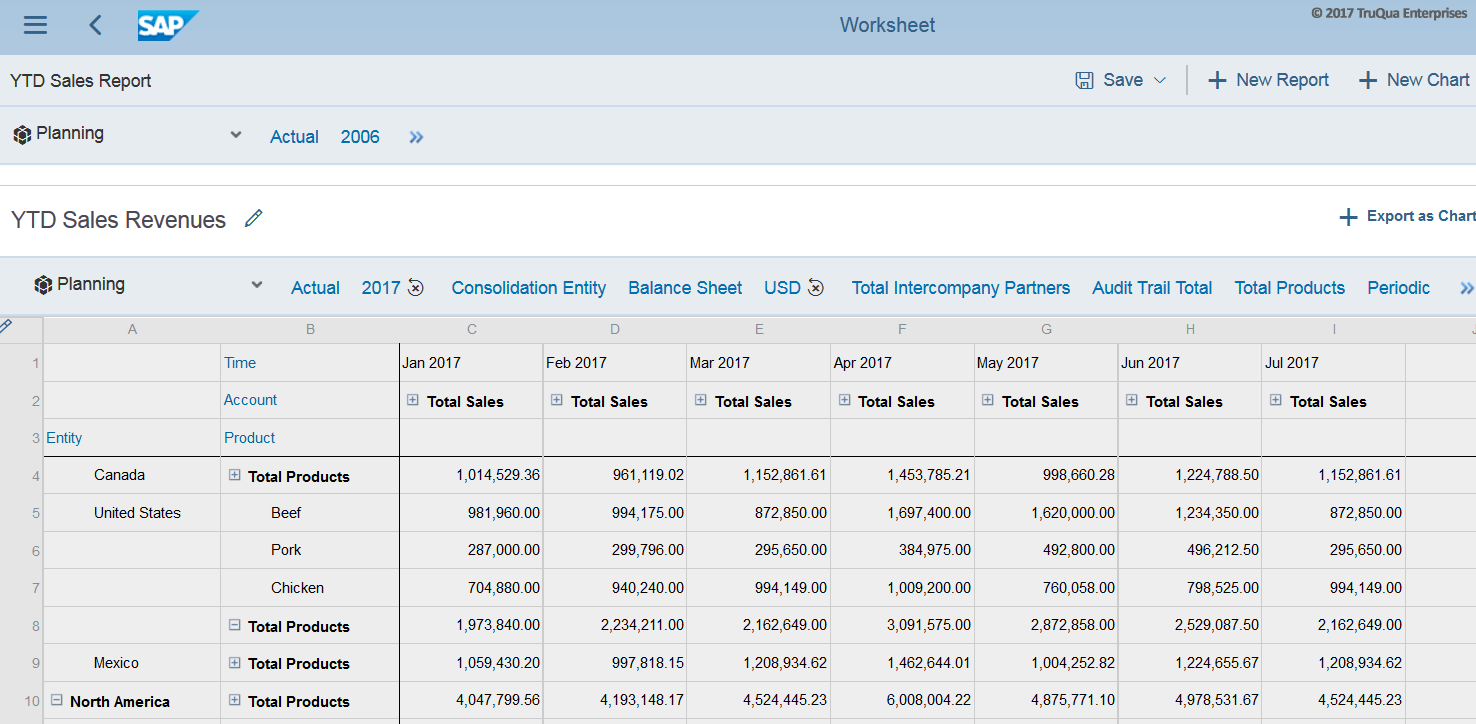
Noticing an unexpected dip in beef sales during the summer barbeque season, Truman notifies the distribution and trade promotion teams to determine the best strategy for getting beef sales back on track.
Next Truman prepares to generate the sales forecast for the remainder of the year. The Activity Pane makes it simple to go directly to the necessary processes:

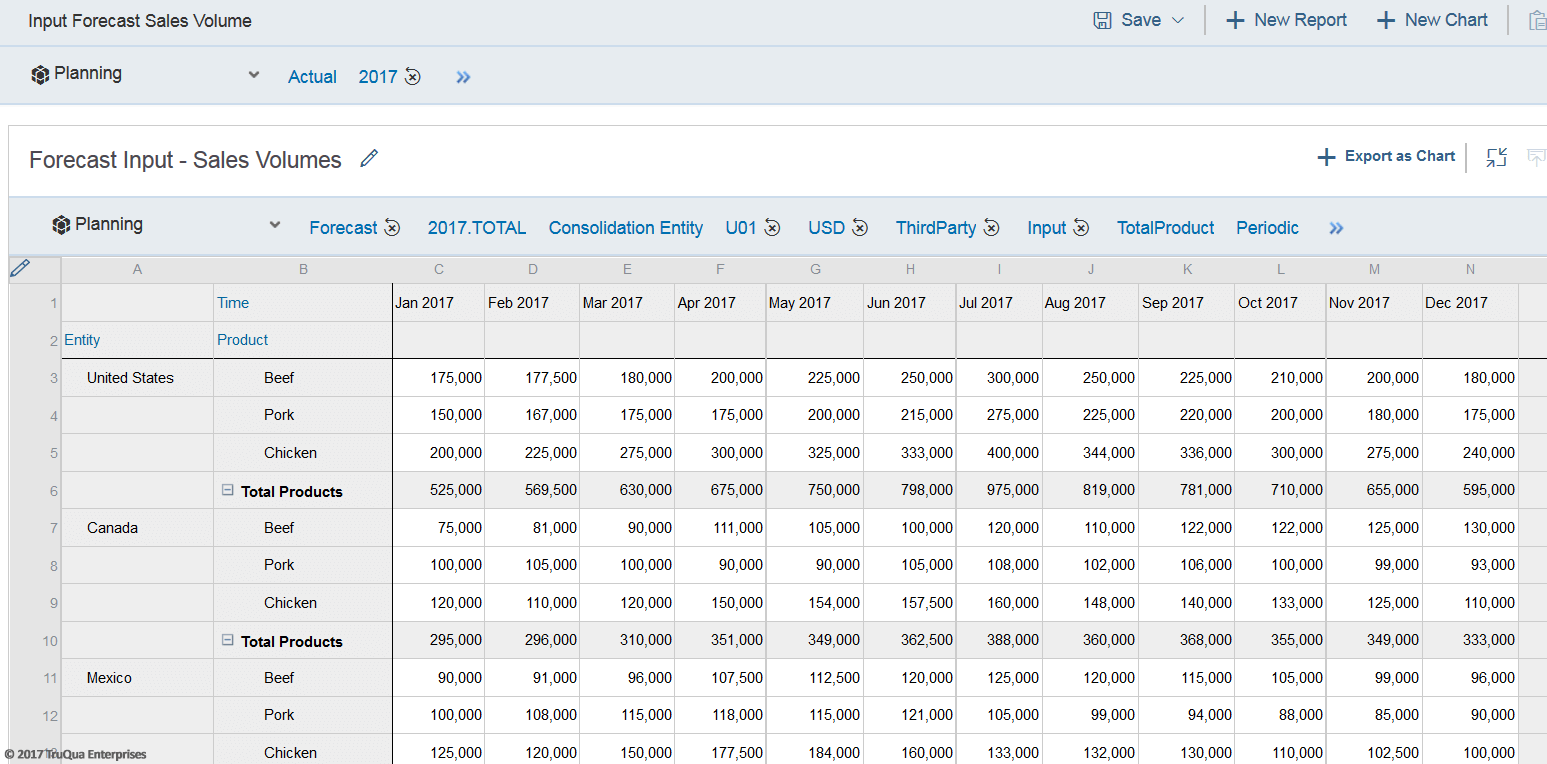
Once the task of loading new sales figures is complete, Truman marks the activity as complete. The next item appears on the SAP BPC 11.0 Activities Timeline: updating the North America forecast for the remainder of the year. Clicking on the activity on his home page will open an input schedule in Excel which he can use to update the projected sales volumes and planned prices for each product in each country in the region.
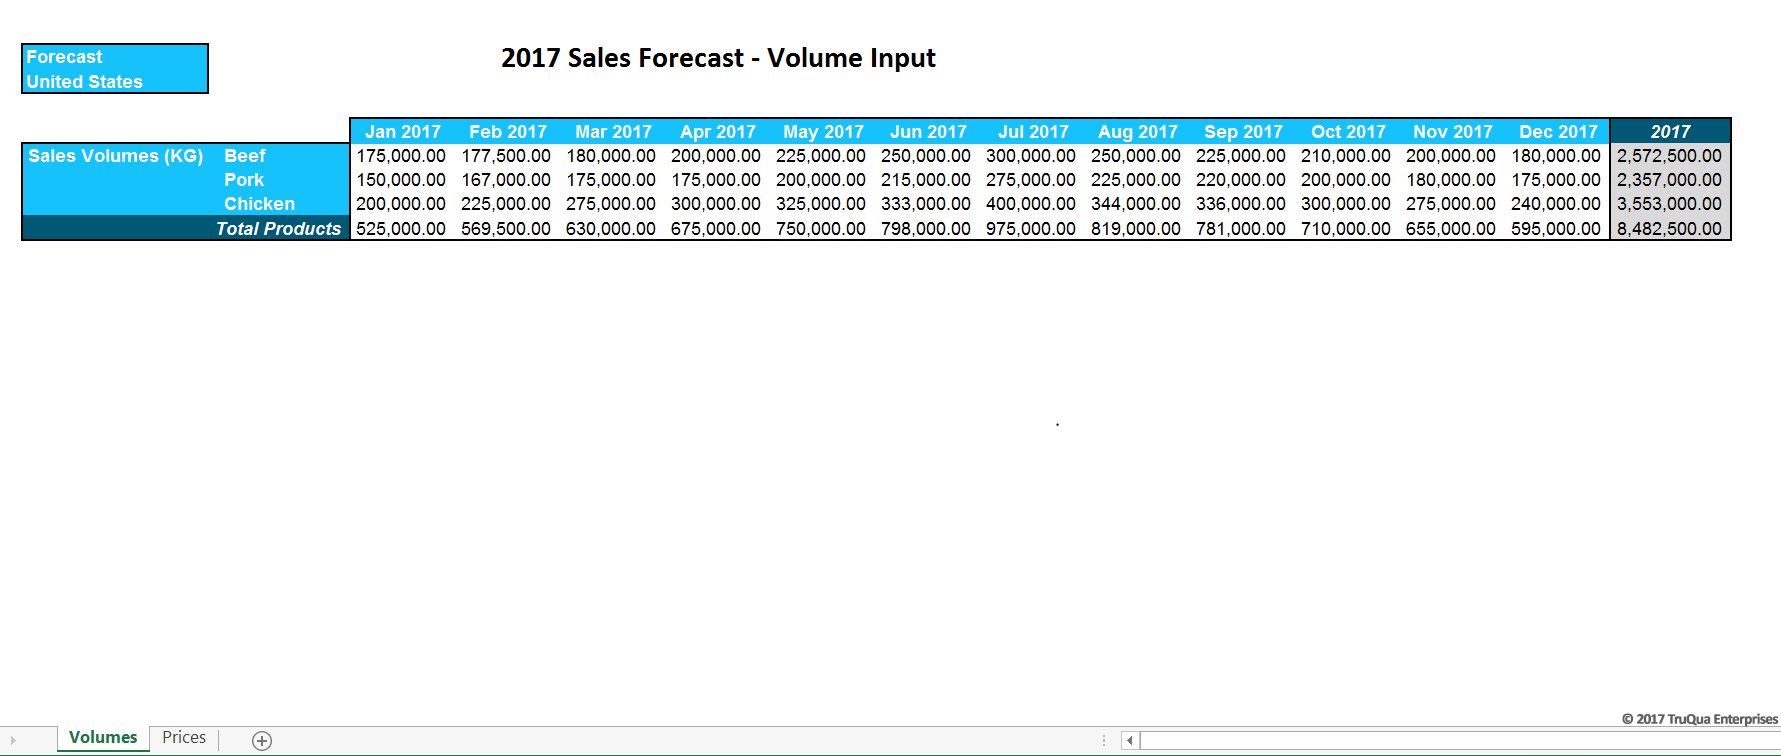
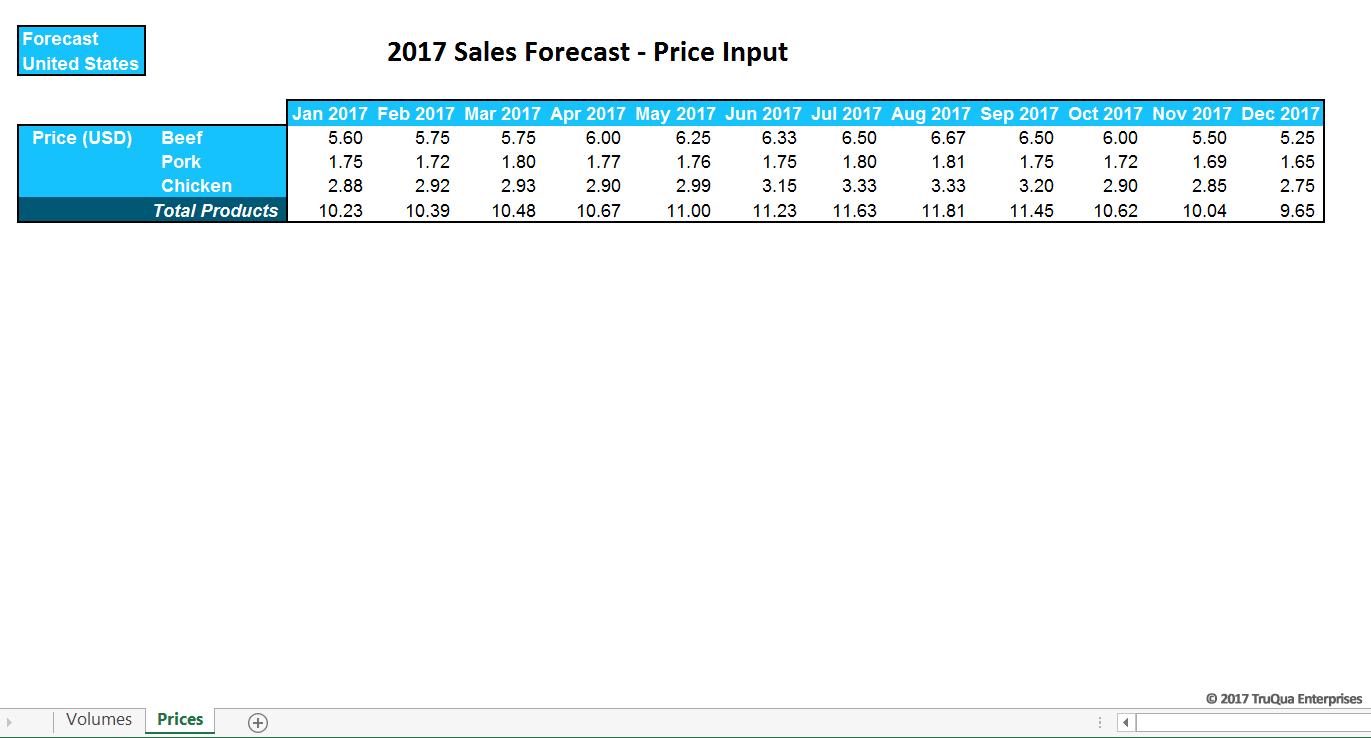
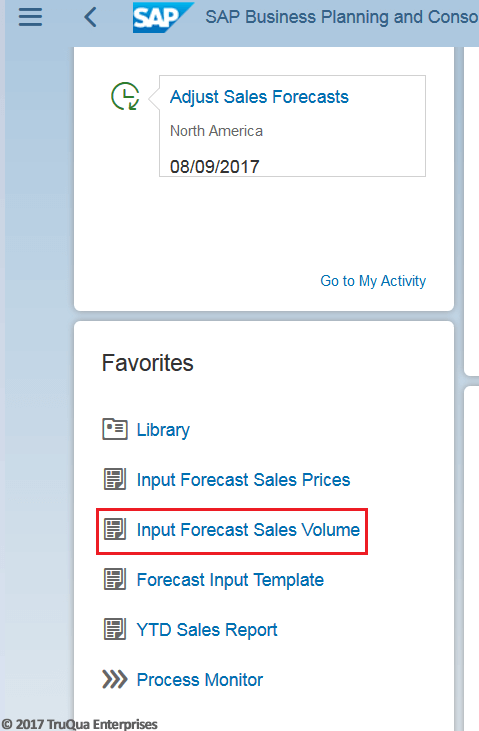
Truman saves a web version of these input schedules to his Favorites list. This will be useful in the event that he needs to go back and modify the forecast later based on the upcoming discussions with the distribution and trade promotion teams.
In order to more closely monitor the sales numbers, Truman adds a chart to break out sales volumes and revenue to his home page. This allows him to easily monitor which countries are selling the most product and producing the most revenue, and to understand whether a price increase or decrease is warranted for a given area.
Notable Features of SAP BPC 11.0 on BW/4HANA
As highlighted above, there are several key features which make up the improved SAP BPC 11.0 user experience.
- Customizing the Home Page
The home page consists of:
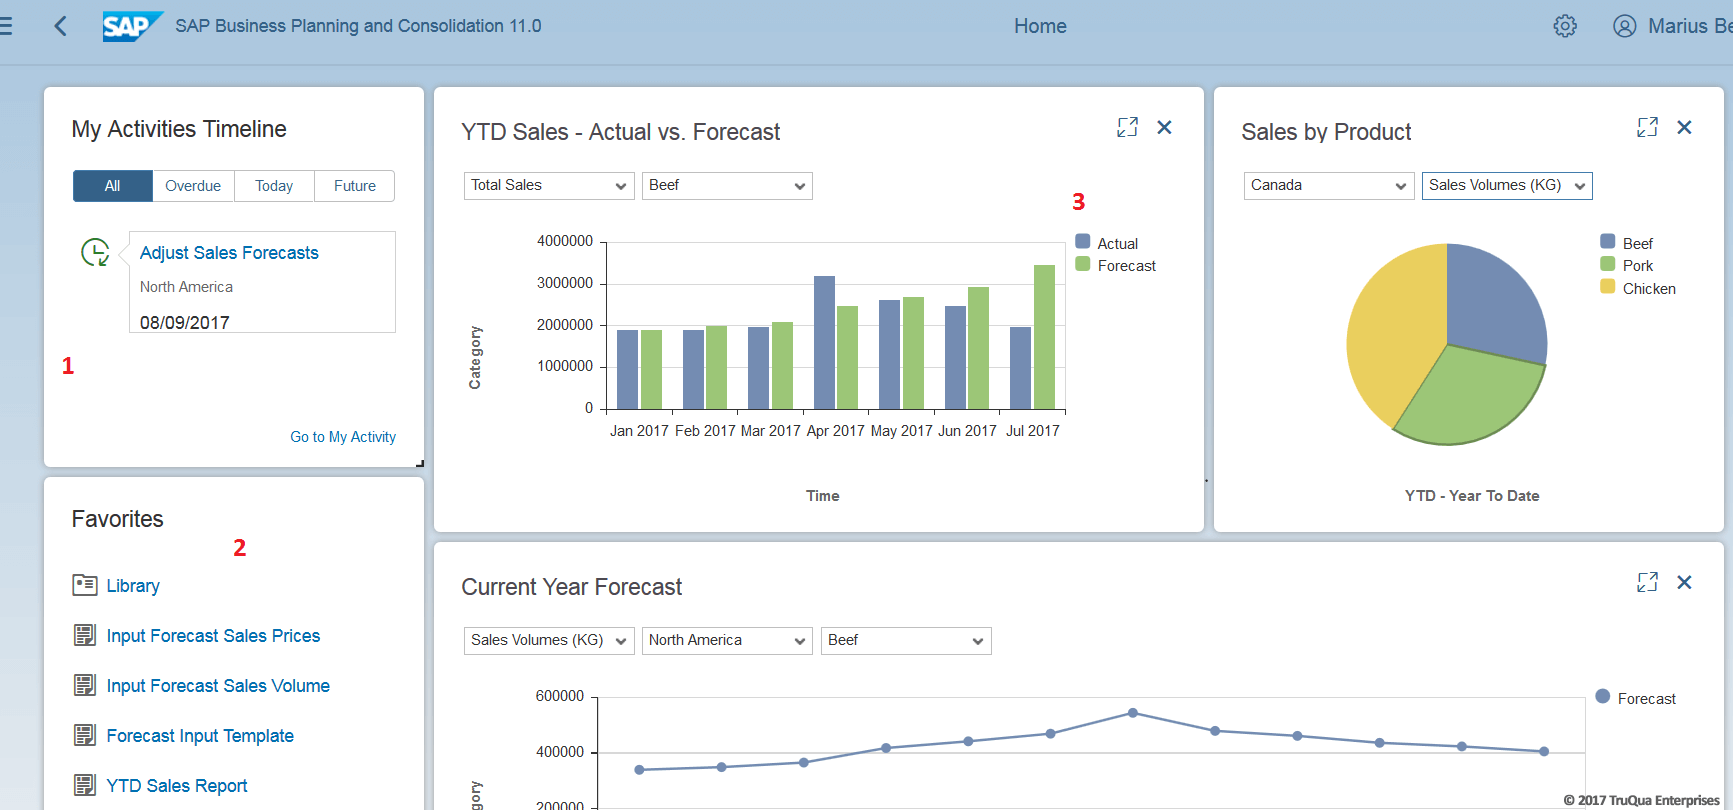
- A “Favorites” menu, where the user can add links to quickly access various BPC web screens that they may need to reuse frequently in their daily tasks
- An “Activities Timeline”, which reminds the user of any tasks assigned to them with a deadline attached, and provides the links to complete them.
- Any BPC web charts or reports that the user has pinned for instant viewing upon opening their Home Page
The user can resize and rearrange these windows to suit their preferences.
2. Favorites Links:
User can add web reports or any BPC11.0 screen to their “Favorites” list. On each page of the BPC11 web client, the user simply clicks on the star in the upper right corner of the page. The user is then able to access that screen directly from their home page.

Once this is done, the user should be able to link directly to that screen from their Home Page.
3. Pinning Web Charts
To create a web chart in SAP BPC 11.0, the user can go to the “Library” screen (the link can be saved to their Favorites) and create a new worksheet that is defined as a Web Chart. This can be built to visualize the data as a bar chart, line graph, or pie chart.
A Web Chart can be pinned to the user’s home page directly by using the thumbtack button in the upper right of the page (pictured below).
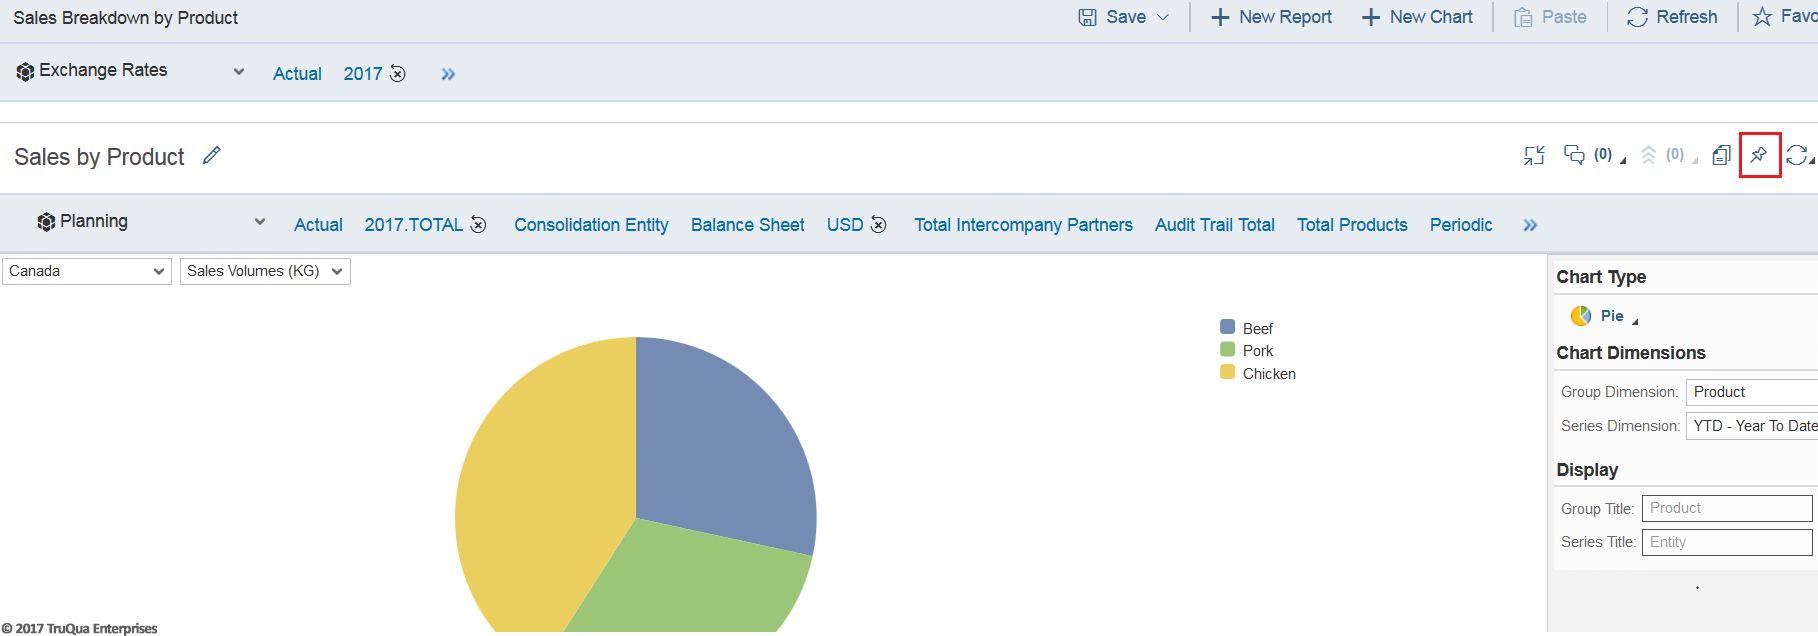
Once this is done the chart becomes available for immediate viewing in the user’s home page; they check the data instantly without opening any external web or EPM links, and can visualize their data in the way that is most relevant to their job role.
4. Improved Navigation
In addition to customizing the home page, SAP BPC 11.0 introduces other improvements to the navigation that was seen in previous versions:
- Hamburger menu: this allows the user to navigate to any of the screens in the SAP BPC 11.0 web client.
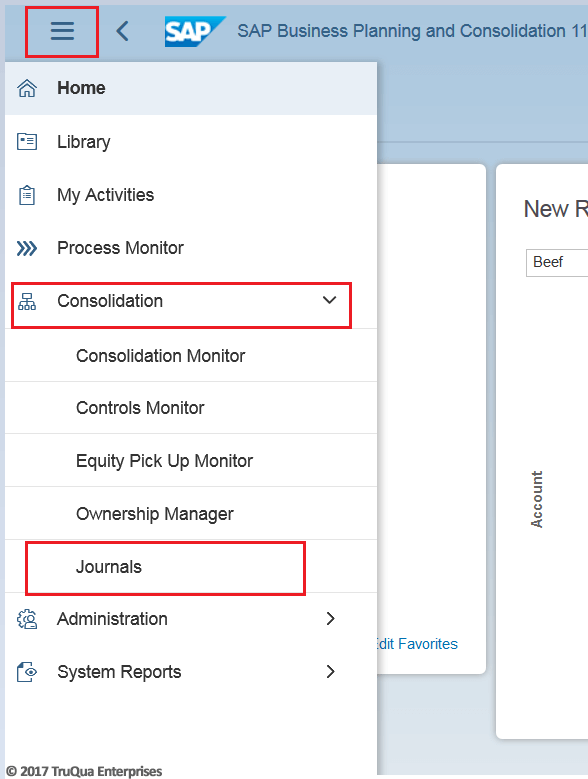
This menu remains hidden from view until the user expands it out by clicking the button, allowing them to allocate more screen space towards customizing their home page.
Additionally, the menu allows the user to instantly drill down to the subsequent child pages for each web screen; this improves the design by minimizing the time and the number of clicks it takes to get to their final destination. In the above screenshot, the user can navigate from the Home Page to the Journals page in one click, whereas in previous versions they would have to click through and load multiple pages (“Home”->”Consolidation”->”Journals”). This design also reduces instances of backtracking due to selecting an incorrect parent page.
- “Breadcrumb” path navigation:
In addition to navigating directly from the Home Page to the bottom of the desired path, SAP BPC 11.0 has also introduced a “breadcrumb” folder path design to easily navigate back through each step of a path.

For example, when looking at a specific BPF activity, the user can use the breadcrumb path to click back to the BPF definition (“Sales Forecast”) or even back to the list of BPFs to select a new one to view/update (“Process Templates”).
5. SAP Fiori based Design
SAP BPC 11.0 was built using SAP Fiori design principles, providing a look and feel that is consistent with modern SAP applications and a focus on providing a visually pleasing tool that is simple and intuitive to the end user.
Conclusion:
With a focus on providing more efficient and more customized navigation options, SAP BPC 11.0 delivers several significant UX improvements upon previous versions. These improvements allow previously under-utilized functionality, such as web reports and business process flows to be better utilized in the planning process. The look and feel have been designed to be consistent with modern SAP applications, and the overall result is a planning solution that is focused on creating a more simplified and easy-to-use solution for the end-user. For more information on TruQua, visit us online at www.truqua.com
